Interactive Data Visualization with R Shiny for Life Sciences
Day 1: Introduction
Michael Teske & Jonas Schmid, Zurich 08 April 2024What is R Shiny?

Shiny is an R package that makes it easy to build interactive web applications (apps) straight from R.
Easy web apps for data science without the compromises
https://shiny.posit.co/
What we will create
Something similar to this - different flavors possible, depending on your needs!
Schedule
Day 1
- Introduction to R Shiny, your first app
- Quick review of ggplot2
- Exploring Widgets
- Creating a dashboard
Day 2
- Implementing interactive plot functions
- Advanced R Shiny customization
- Deploying Shiny apps
Assignment
Requirements




								install.packages("shiny")
								install.packages("tidyverse")
								library(shiny)
								runExample("01_hello")
Anatomy of R Shiny
A Shiny app is a web page (ui) connected to a computer running a live R session (server).


Users can manipulate the UI, which will cause the server to update the UI's displays (by running R code).
UI: Layouts
fluidPage
(default)

									ui <- fluidPage(
										titlePanel("Hello Shiny!"),
										sidebarLayout(
											sidebarPanel(…),
											mainPanel(…)
										)
									)
shinyDashboard
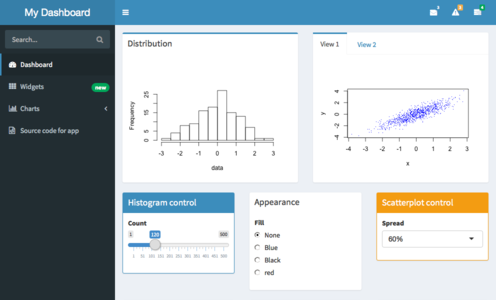
									library(shinydashboard)

									ui <- dashboardPage(
										dashboardHeader(),
										dashboardSidebar(),
										dashboardBody(
											fluidRow(
												box(…)
											)
										)
									)
bslib
(new generation)
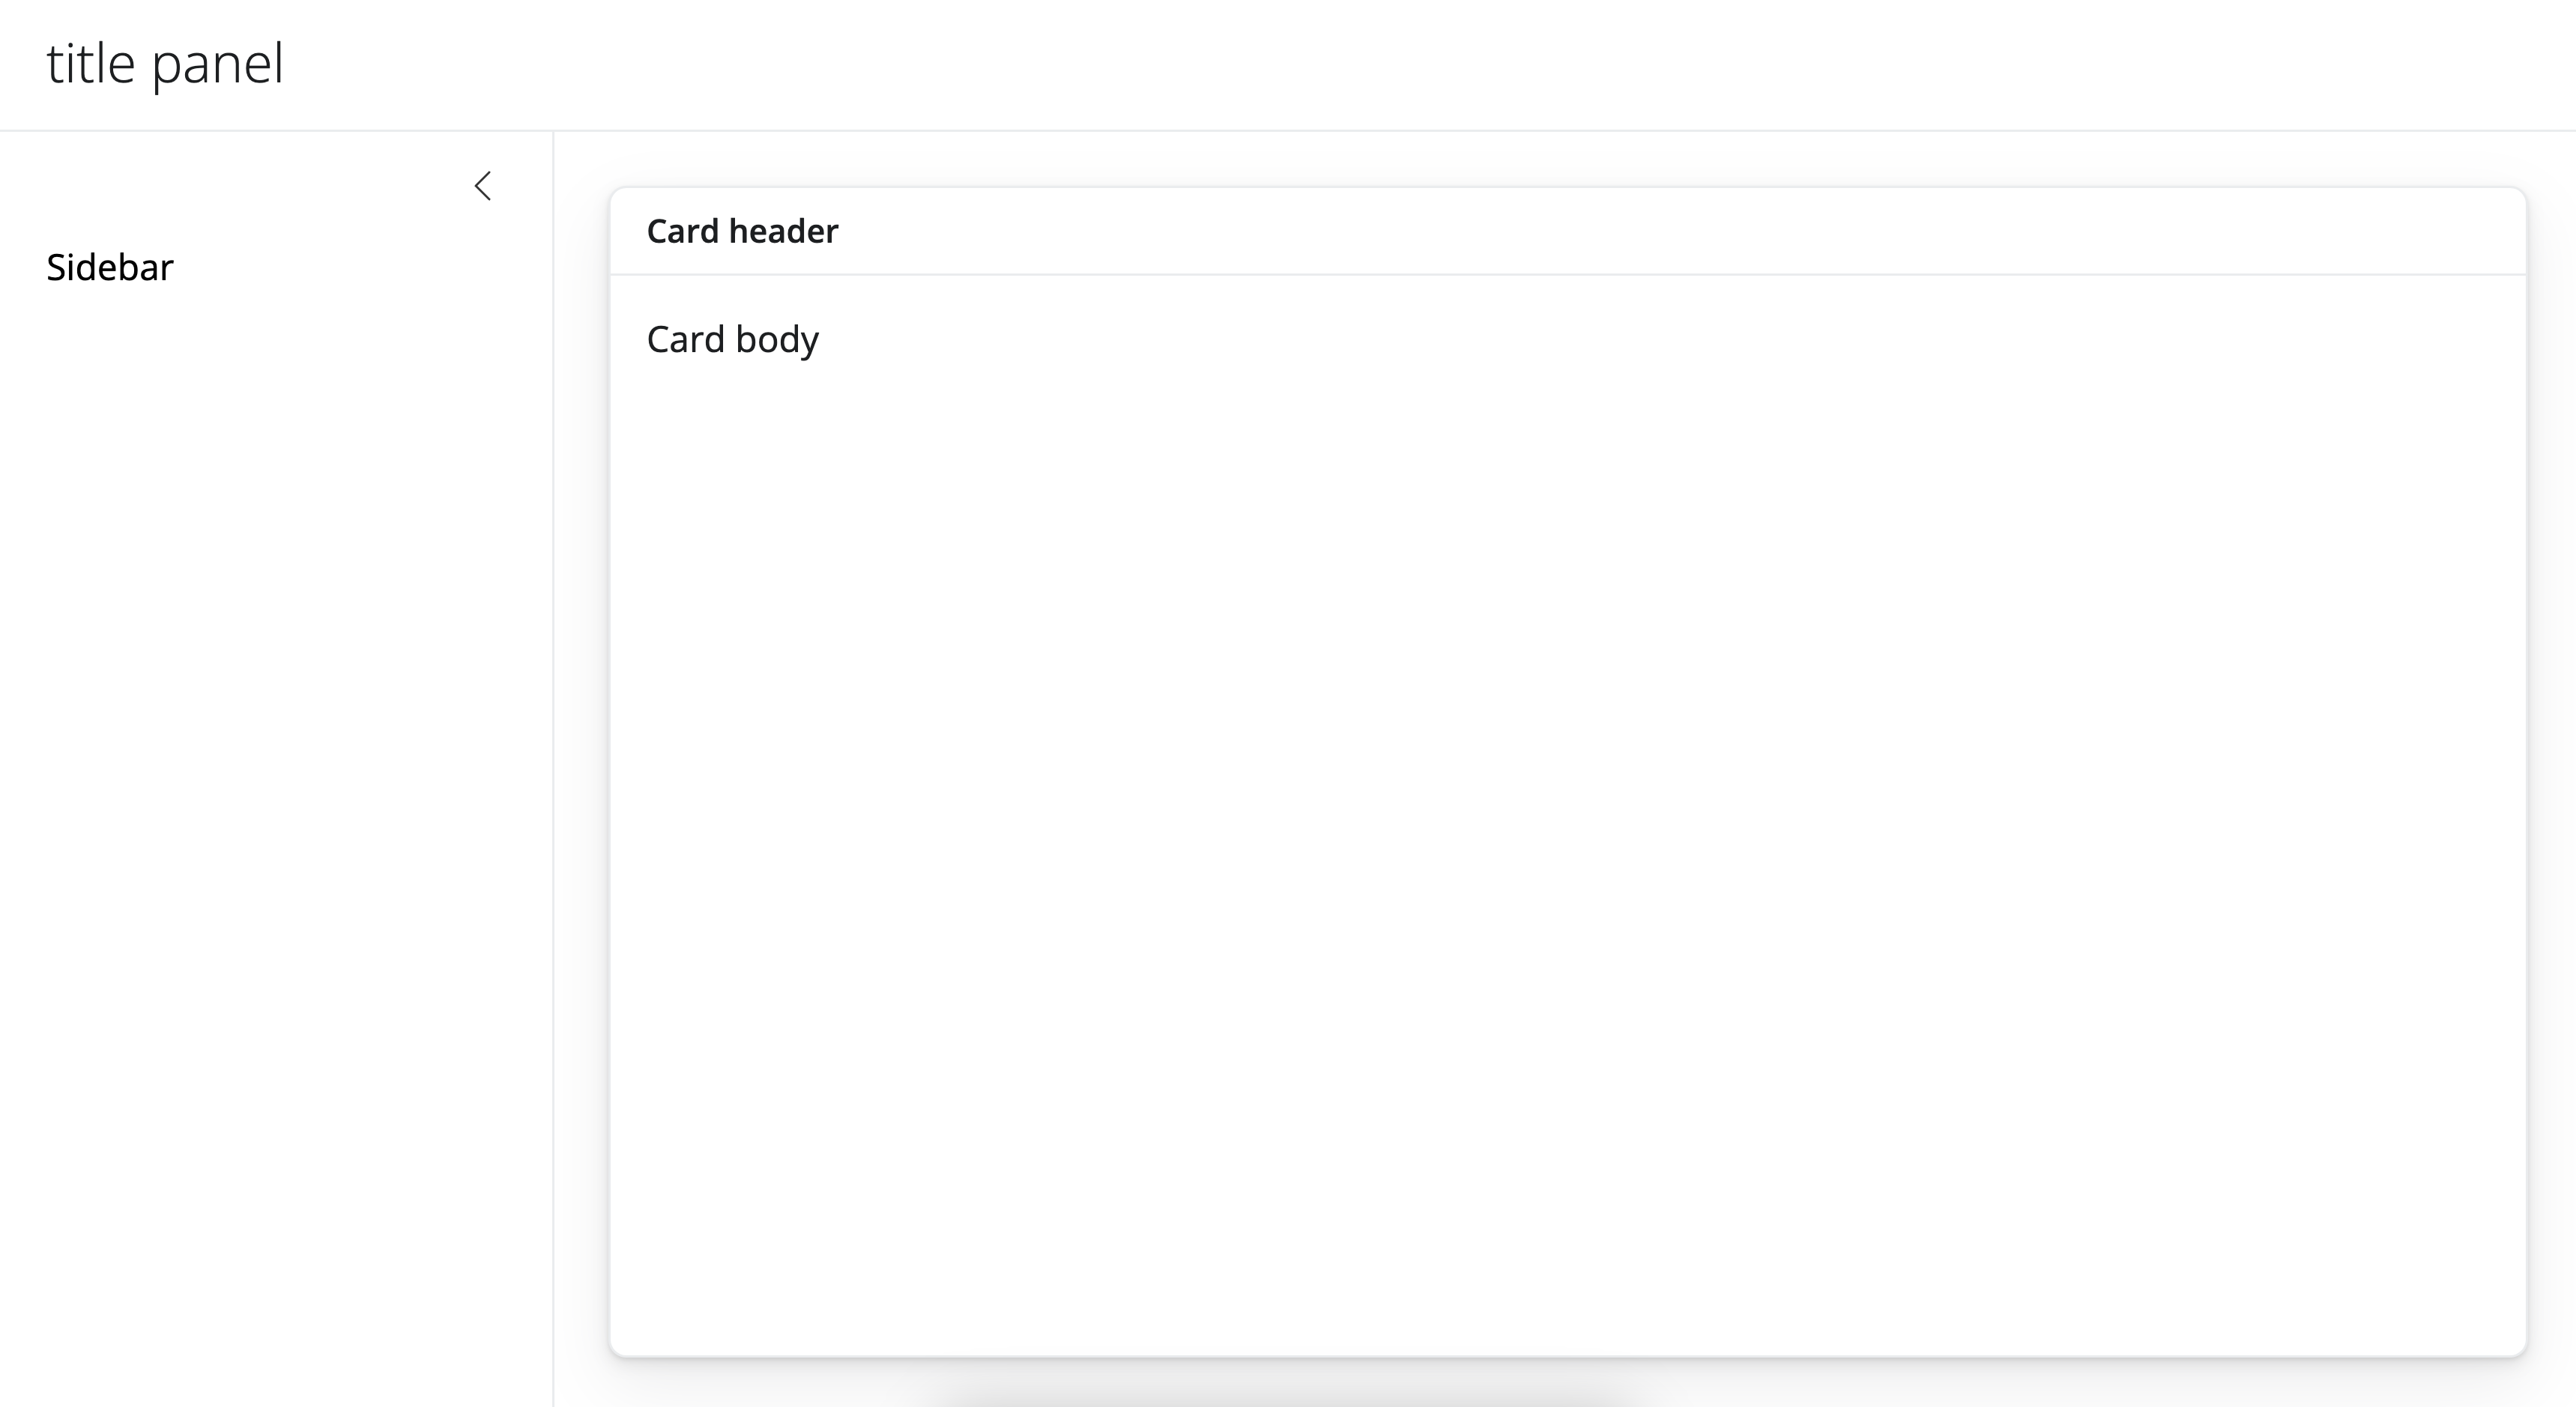
									library(bslib)

									ui <- page_sidebar(
										title   = "title panel",
										sidebar = sidebar(…),
										card(… ) # main content
									)
...
User Interface: Widgets
https://shiny.posit.co/r/gallery/widgets/widget-gallery/The User interface provides input to the server
									sliderInput(
										inputId = "bins",
										label   = "Number of bins:",
										min     = 1,
										max     = 50,
										value   = 30
									)
⬇
input$bins
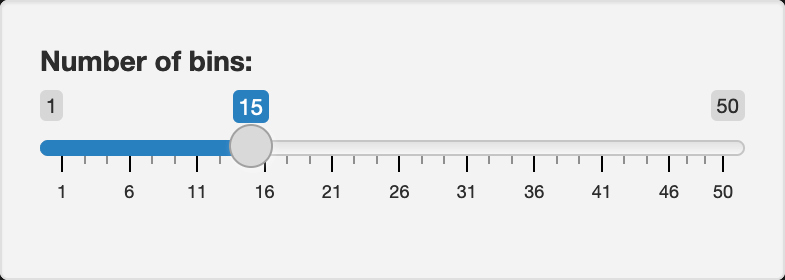 →
→ print(input$bins) # 15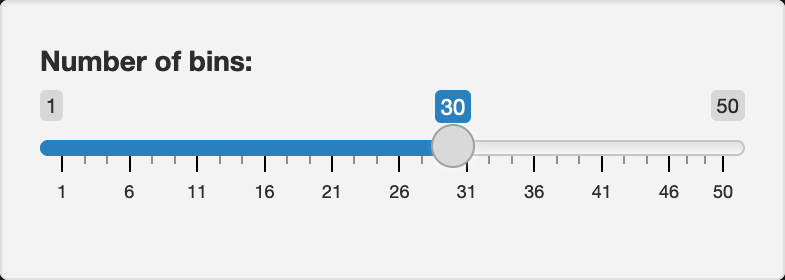 →
→ print(input$bins) # 30The server updates the output
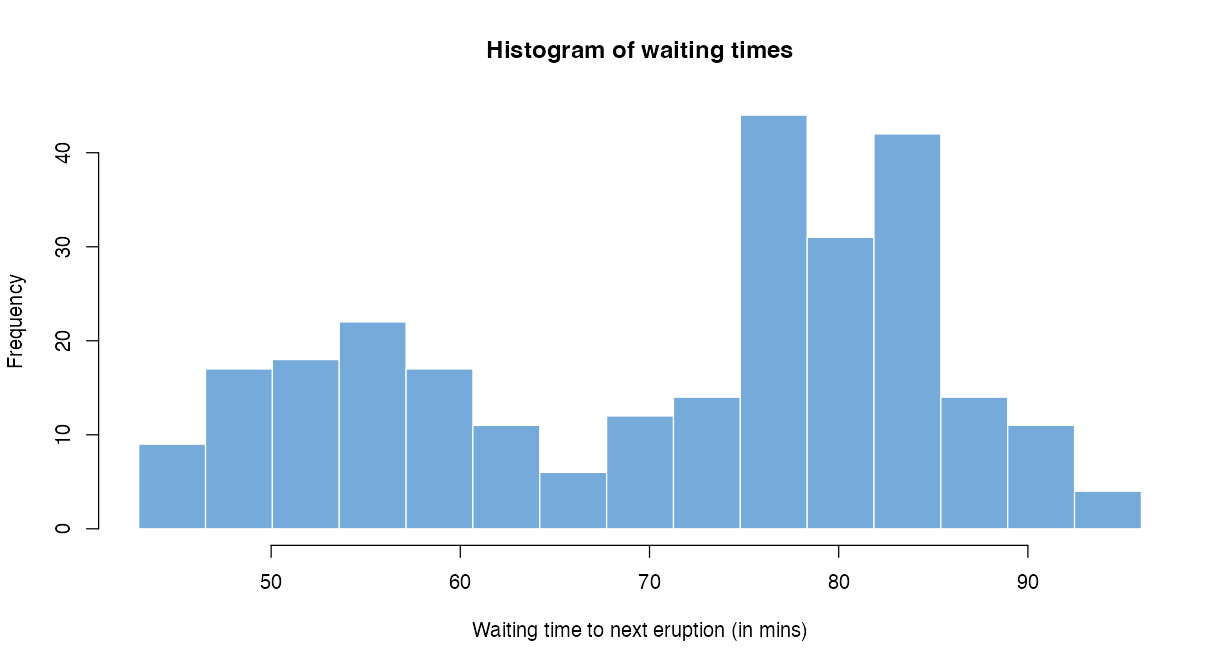
										mainPanel(
											plotOutput(outputId = "distPlot")
										)
⬆
									server <- function(input, output) {

										output$distPlot <- renderPlot({

											x    <- faithful$waiting
											bins <- seq(
												min(x),
												max(x),
												length.out = input$bins + 1
											)

											hist(
												x,
												breaks = bins,
												col    = "#75AADB",
												border = "white",
												xlab   = "Waiting time to...",
												main   = "Histogram of..."
											)

										})

									}
The server updates the output
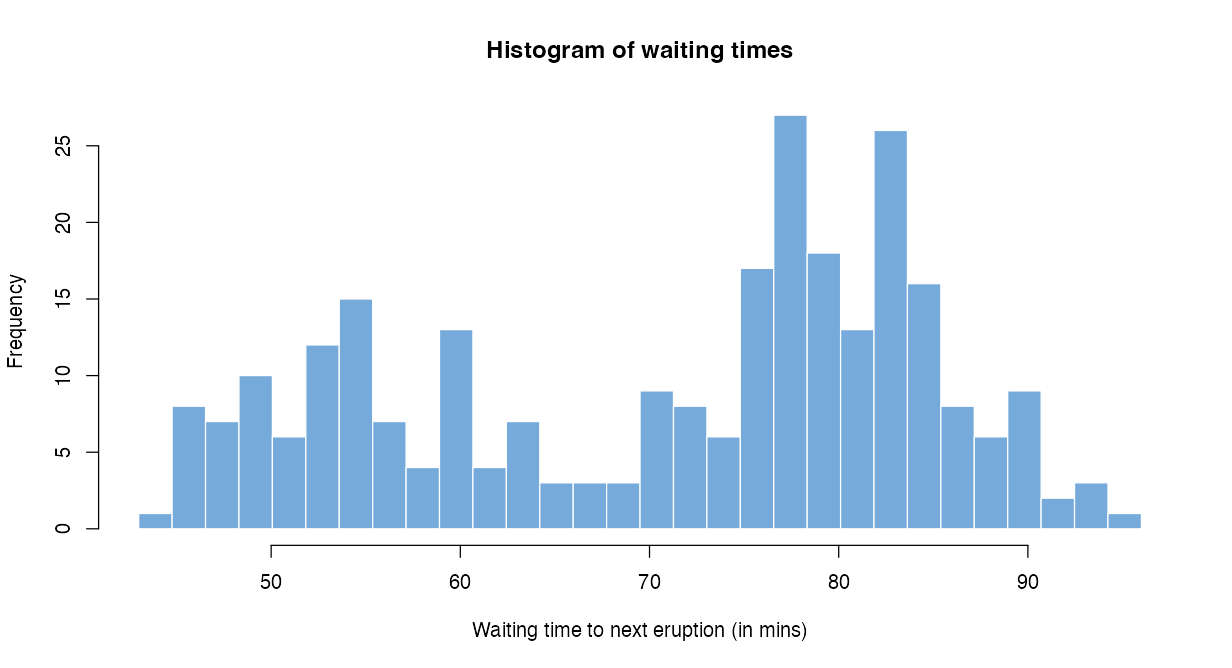
										mainPanel(
											plotOutput(outputId = "distPlot")
										)
⬆
									server <- function(input, output) {

										output$distPlot <- renderPlot({

											x    <- faithful$waiting
											bins <- seq(
												min(x),
												max(x),
												length.out = input$bins + 1
											)

											hist(
												x,
												breaks = bins,
												col    = "#75AADB",
												border = "white",
												xlab   = "Waiting time to...",
												main   = "Histogram of..."
											)

										})

									}
Output Rendering functions
| Output function | Creates |
| dataTableOutput | DataTable |
| htmlOutput | raw HTML |
| imageOutput | image |
| plotOutput | plot |
| tableOutput | table |
| textOutput | text |
| uiOutput | raw HTML |
| verbatimTextOutput | text |
Output Rendering functions
| Output function | Creates |
| dataTableOutput | DataTable |
| htmlOutput | raw HTML |
| imageOutput | image |
| plotOutput | plot |
| tableOutput | table |
| textOutput | text |
| uiOutput | raw HTML |
| verbatimTextOutput | text |
Exercise 1
Resources:
- exercises/1_calculator.R
- Input widgets: Shiny widget gallery
- Render functions: Shiny CHEATSHEET
Exercise 1
Task: Complete the code for the calculator app!
- Add a nice title
- Add two widgets for the numeric input (Numeric input, Slider...)
- Add one widget for the mathematical operation (Radio buttons, Select box...)
- Use the inputs in the server function (change placeholders)
- Add the output of the calculation to the UI
- Use req(input$num2 != 0) for safe division (?req)
15 min

Exercise 1
One possible solution:
								library(shiny)

								# Define UI
								ui <- fluidPage(
									titlePanel("Shiny Calculator"),

									sidebarLayout(
										sidebarPanel(
											numericInput("num1", label = "Enter first number:", value = 0),
											numericInput("num2", label = "Enter second number:", value = 0),
											radioButtons("operation", label = "Choose operation:", choices = list(
												"add",
												"subtract",
												"multiply",
												"divide"
											))
										),

										mainPanel(
											textOutput("result")
										)
									)
								)

								# Define server logic
								server <- function(input, output) {

									output$result <- renderText({
										if (input$operation == "divide") {
											req(input$num2 != 0)
										}

										result <- switch(input$operation,
											"add"      = input$num1 + input$num2,
											"subtract" = input$num1 - input$num2,
											"multiply" = input$num1 * input$num2,
											"divide"   = input$num1 / input$num2
										)

										paste("Result:", result)
									})

								}

								# Run the application
								shinyApp(ui = ui, server = server)
Exercise 1 - Continued
What can we do if we need the result of the calculation more than once?
									server <- function(input, output) {

										output$result <- renderText({
											if (input$operation == "divide") {
												req(input$num2 != 0)
											}

											result <- switch(input$operation,
												"add"      = input$num1 + input$num2,
												"subtract" = input$num1 - input$num2,
												"multiply" = input$num1 * input$num2,
												"divide"   = input$num1 / input$num2
											)

											paste("Result:", result)
										})

										output$otherResult <- renderText({
											if (input$operation == "divide") {
												req(input$num2 != 0)
											}

											result <- switch(input$operation,
												"add"      = input$num1 + input$num2,
												"subtract" = input$num1 - input$num2,
												"multiply" = input$num1 * input$num2,
												"divide"   = input$num1 / input$num2
											)

											otherResult <- result + 1

											paste("The other result:", otherResult)
										})

									}
Duplicated code
									# Define server logic
									server <- function(input, output) {

										result <- reactive({
											if (input$operation == "divide") {
												req(input$num2 != 0)
											}

											switch(input$operation,
												"add"      = input$num1 + input$num2,
												"subtract" = input$num1 - input$num2,
												"multiply" = input$num1 * input$num2,
												"divide"   = input$num1 / input$num2
											)
										})

										output$result <- renderText({
											paste("Result:", result())
										})

										output$otherResult <- renderText({
											otherResult <- result() + 1
											paste("The other result:", otherResult)
										})

									}
Encapsulation
Exercise 1 - Continued
Task: Encapsulate the result calculation!
- Add a nice title
- Add two widgets for the numeric input (Numeric input, Slider...)
- Add one widget for the mathematical operation (Radio buttons, Select box...)
- Use the inputs in the server function (change placeholders)
- Add the output of the calculation to the UI
- Use req(input$num2 != 0) for safe division (?req)
- Encapsulate the calculation in result <- reactive({...})
5 min

Exercise 1 - Continued
One possible solution:
								library(shiny)

								# Define UI
								ui <- fluidPage(
									titlePanel("Shiny Calculator"),

									sidebarLayout(
										sidebarPanel(
											numericInput("num1", "Enter first number:", value = 0),
											numericInput("num2", "Enter second number:", value = 0),
											radioButtons("operation", "Choose operation:", choices = list(
												"add",
												"subtract",
												"multiply",
												"divide"
											))
										),

										mainPanel(
											textOutput("result")
										)
									)
								)

								# Define server logic
								server <- function(input, output) {

									result <- reactive({
										if (input$operation == "divide") {
											req(input$num2 != 0)
										}

										switch(input$operation,
											"add"      = input$num1 + input$num2,
											"subtract" = input$num1 - input$num2,
											"multiply" = input$num1 * input$num2,
											"divide"   = input$num1 / input$num2
										)
									})

									output$result <- renderText({
										paste("Result:", result())
									})

								}

								# Run the application
								shinyApp(ui = ui, server = server)
Reactive Programming in R Shiny
Classic R
									x <- 2
									y <- x + 1
									print(y) #3
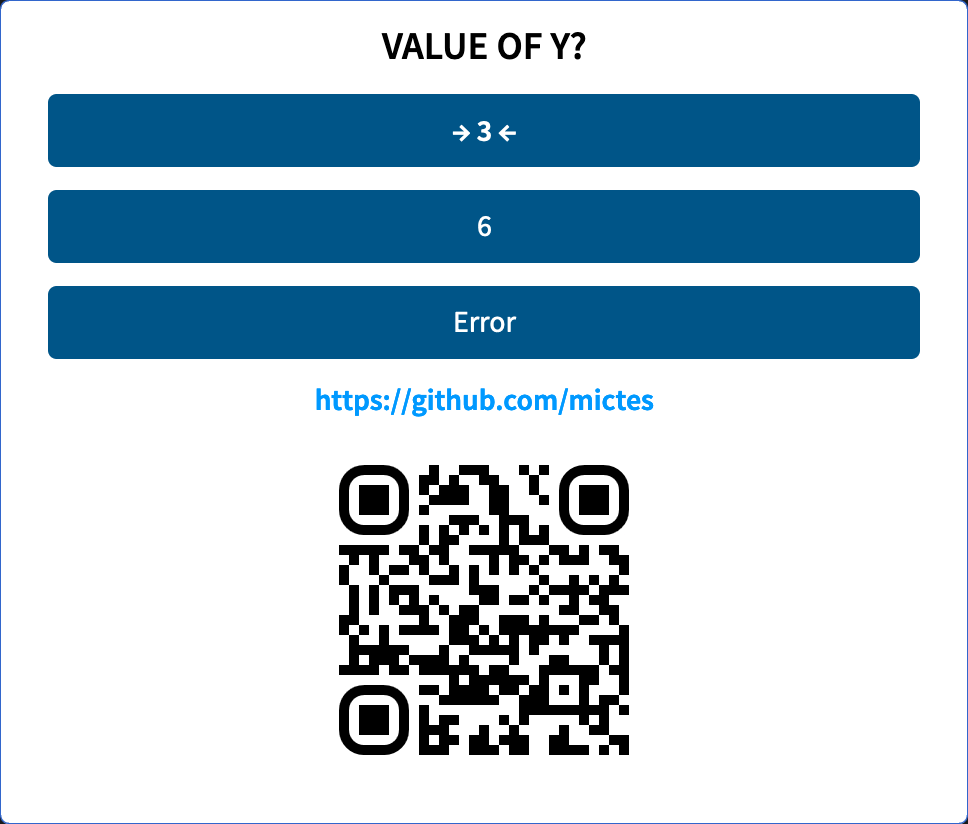
Reactive Programming in R Shiny
Classic R
									x <- 2
									y <- x + 1
									print(y) #3

									x <- 5
									print(y) #?
Reactive Programming in R Shiny
Classic R
									x <- 2
									y <- x + 1
									print(y) #3

									x <- 5
									print(y) #3
Imperative programming
(sequential)
R Shiny
									x <- 2
									y <- reactive(x + 1)
									print(y) #3

									x <- 5
									print(y) #6
Declarative style "Recipe"
Reactive Programming in R Shiny
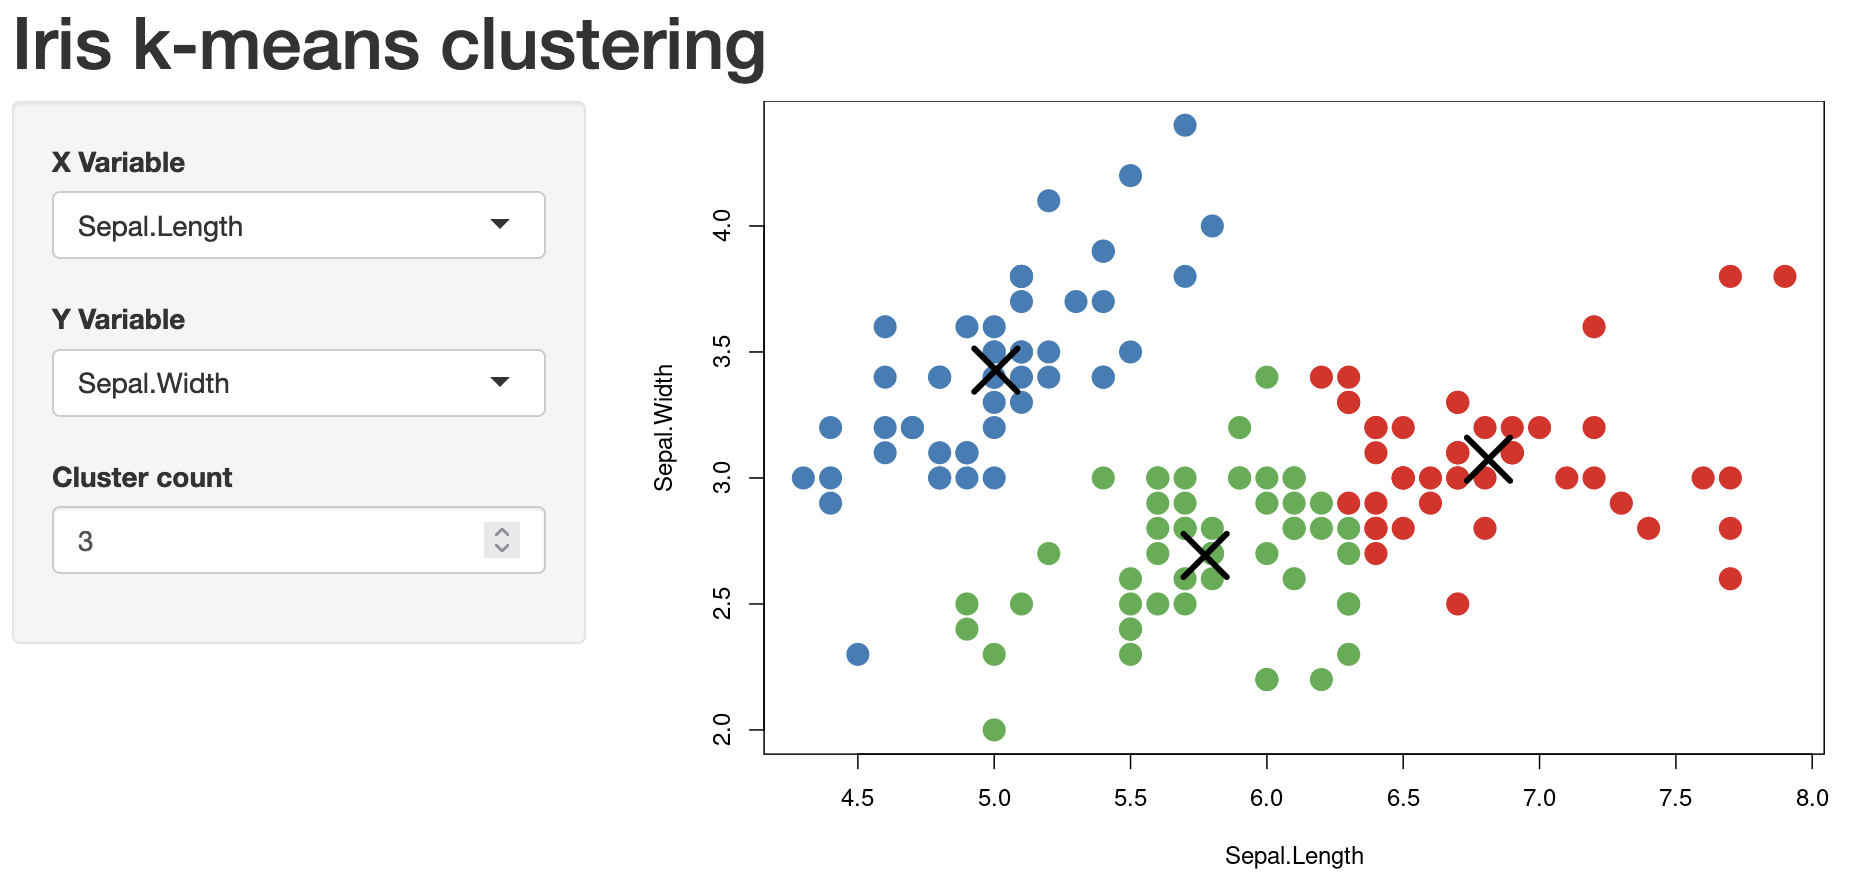
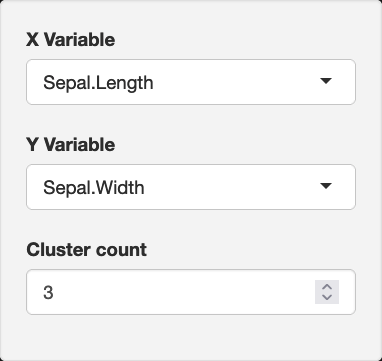
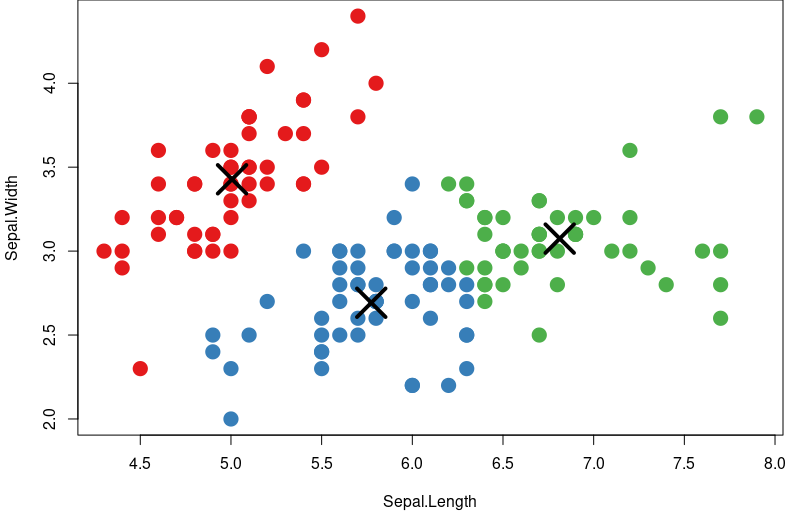
Example: k-means app from the Shiny for R Gallery

Reactive Programming in R Shiny
Example: k-means app from the Shiny for R Gallery

Reactive Programming in R Shiny
Reactive expressions are only accessible within reactive consumers
									# Define server logic
									server <- function(input, output) {

										result <- reactive({
											# Handling division by zero with req()
											if (input$operation == "divide") {
												req(input$num2 != 0)
											}

											switch(input$operation,
														"add"      = input$num1 + input$num2,
														"subtract" = input$num1 - input$num2,
														"multiply" = input$num1 * input$num2,
														"divide"   = input$num1 / input$num2
											)
										})

										# print(input$num1) also would not work
										print(result())

										output$result <- renderText({
											paste("Result:", result())
										})

									}
Error in .getReactiveEnvironment()$currentContext() :
Operation not allowed without an active reactive context.
• You tried to do something that can only be done from inside a reactive consumer.
Automatic Dependency Tracking
Dependents dynamically register callbacks in reactive sources

									output$plot1 <- renderPlot({
										palette(c("#E41A1C", "#377EB8", "#4DAF4A", "#984EA3",
															"#FF7F00", "#FFFF33", "#A65628", "#F781BF", "#999999"))

										par(mar = c(5.1, 4.1, 0, 1))
										plot(selectedData(),
												col = clusters()$cluster,
												pch = 20, cex = 3)
										points(clusters()$centers, pch = 4, cex = 4, lwd = 4)
									})
Automatic Dependency Tracking
Dependents dynamically register callbacks in reactive sources

									output$plot1 <- renderPlot({
										palette(c("#E41A1C", "#377EB8", "#4DAF4A", "#984EA3",
															"#FF7F00", "#FFFF33", "#A65628", "#F781BF", "#999999"))

										par(mar = c(5.1, 4.1, 0, 1))
										plot(selectedData(),
												col = clusters()$cluster,
												pch = 20, cex = 3)
										points(clusters()$centers, pch = 4, cex = 4, lwd = 4)
									})
Automatic Dependency Tracking
Dependents dynamically register callbacks in reactive sources

									output$plot1 <- renderPlot({
										palette(c("#E41A1C", "#377EB8", "#4DAF4A", "#984EA3",
															"#FF7F00", "#FFFF33", "#A65628", "#F781BF", "#999999"))

										par(mar = c(5.1, 4.1, 0, 1))
										plot(selectedData(),
												col = clusters()$cluster,
												pch = 20, cex = 3)
										points(clusters()$centers, pch = 4, cex = 4, lwd = 4)
									})
Automatic Dependency Tracking
Dependents dynamically register callbacks in reactive sources

									# Combine the selected variables into a new data frame
									selectedData <- reactive({
										iris[, c(input$xcol, input$ycol)]
									})

									clusters <- reactive({
										kmeans(
											selectedData(),
											input$clusters
										)
									})
Automatic Dependency Tracking
Dependents dynamically register callbacks in reactive sources

									# Combine the selected variables into a new data frame
									selectedData <- reactive({
										iris[, c(input$xcol, input$ycol)]
									})

									clusters <- reactive({
										kmeans(
											selectedData(),
											input$clusters
										)
									})
Automatic Dependency Tracking
Dependents dynamically register callbacks in reactive sources

									# Combine the selected variables into a new data frame
									selectedData <- reactive({
										iris[, c(input$xcol, input$ycol)]
									})

									clusters <- reactive({
										kmeans(
											selectedData(),
											input$clusters
										)
									})
Re-Calculation of reactive dependencies


Re-Calculation of reactive dependencies
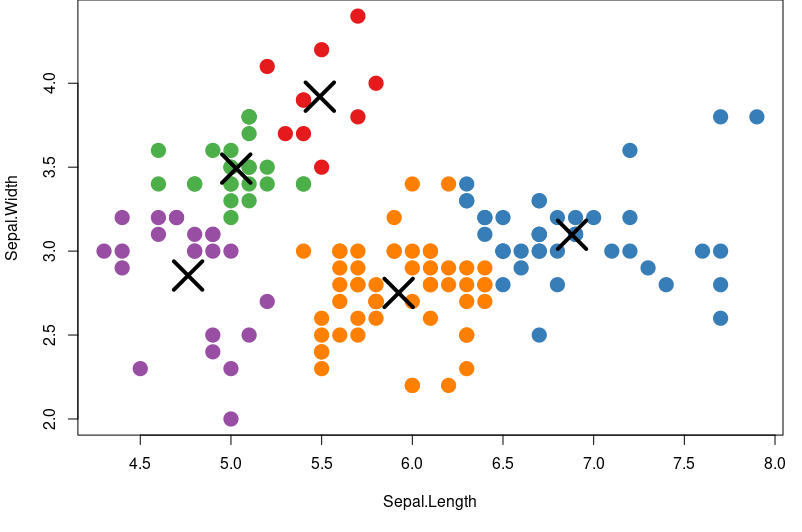
Changed input triggers cascade of invalidation events
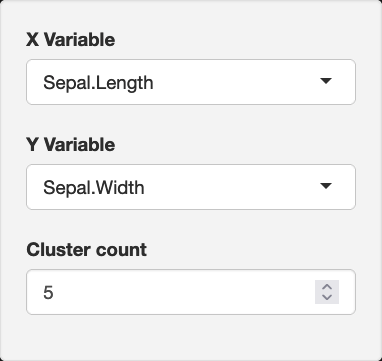


Re-Calculation of reactive dependencies
Changed input triggers cascade of invalidation events


Re-Calculation of reactive dependencies
Changed input triggers cascade of invalidation events


Re-Calculation of reactive dependencies
Invalidated nodes queue the callbacks on the server


Re-Calculation of reactive dependencies
Following collection, the server schedules the execution of the callbacks "flush"


Re-Calculation of reactive dependencies
And invalid nodes become cleared...


Re-Calculation of reactive dependencies
...completing the cycle


Reactive Programming in R Shiny
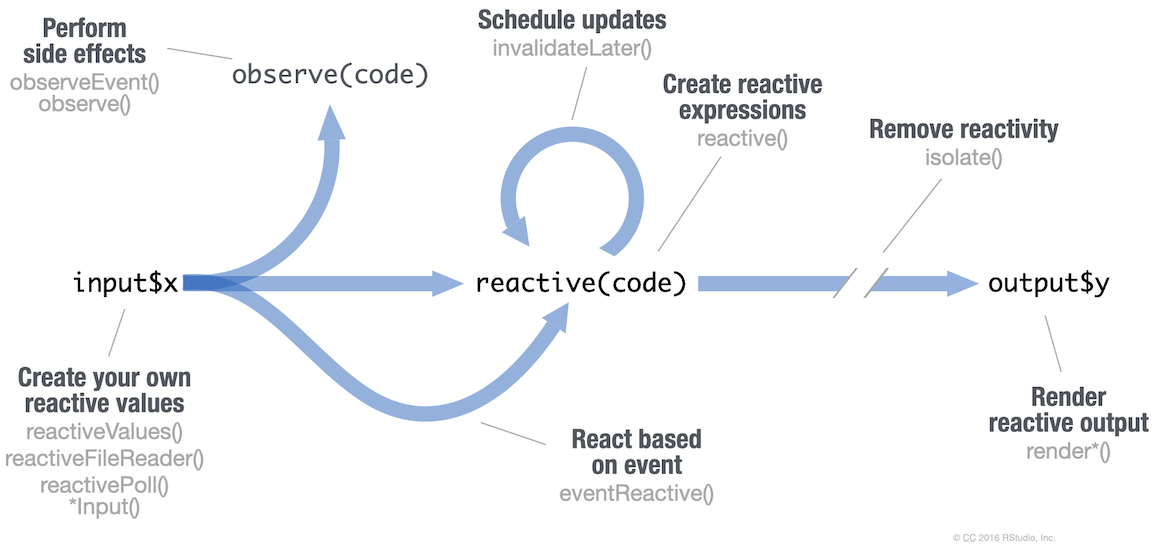
- reactive(): lazy, cached
- observe(): eager, no value returned (arbitrary code)
- reactiveValues(): list of reactive values (like input$...)
- events: click, double-click etc.
- isolate(): stop reactions (avoid dependencies). Useful when many inputs, update often will occur on clicking a button
- invalidateLater(): automatic re-calculation, used in runExample("11_timer")
Best practices
- Encapsulate logical units to minimise dependencies and avoid unnecessary recalculations when irrelevant inputs are changed
- This also helps to avoid the accidental creation of loops
- Use req() to avoid errors due to missing inputs, especially when opening the application
- Carefully check the IDs of the inputs and outputs
- Troubleshooting: use the library(reactlog)
- Modularise, i.e. store ui and server as variables. This for example allows you to dynamically load parts of the UI later.
