Interactive Data Visualization with R Shiny for Life Sciences
Day 2: Milestones
Michael Teske & Jonas Schmid, Zurich 11 April 2024Tips & Tricks from Day 1
Overview

7. shinyDashboard
Requirements:
- shinydashboard package installed
- Your Shiny app code from the end of Day 1 open in R Studio
- Want to start over? Use the solution posted on Slack
7. shinyDashboard
Code from the end of Day 1 (example)
								library(shiny)
								library(tidyverse)
								library(ggbeeswarm)

								data(iris)

								# Define UI
								ui <- fluidPage(
									titlePanel("My Shiny App"),
									sidebarLayout(
										sidebarPanel(
											sliderInput("dotsize", "Dot Size", min=0.1, max=5, value=1, step=0.1),
											downloadButton(
												outputId  = 'save_violinplot',
												label     = 'Save plot',
												icon      = shiny::icon('download')
											)
										),
										mainPanel(
											plotOutput("plot")
										)
									)
								)

								# Define server logic
								server <- function(input, output) {
									violinplot <- reactive({
										ggplot(iris, aes(x=Species, y=Petal.Length)) +
											geom_violin(aes(fill=Species)) +
											geom_quasirandom(size=input$dotsize) +
											geom_boxplot(width=0.1)
									})

									output$plot <- renderPlot({
										violinplot()
									})

									output$save_violinplot <- downloadHandler(
										filename    = 'plot.pdf',
										content     = function(file) {
											ggsave(file, plot=violinplot(), width=297, height=210, unit='mm')
										}
									)
								}

								# Run the application
								shinyApp(ui = ui, server = server)
7. shinyDashboard
fluidPage
(default)
										ui <- fluidPage(
											titlePanel("Hello Shiny!"),
											sidebarLayout(
												sidebarPanel(…),
												mainPanel(…)
											)
										)
shinyDashboard
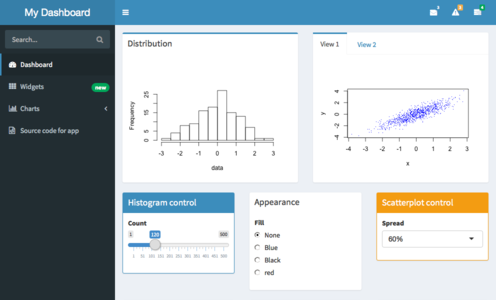
										library(shinydashboard)

										ui <- dashboardPage(
											dashboardHeader(title="..."),
											dashboardSidebar(...),
											dashboardBody(...)
										)
Task: Change the UI to shinyDashboard!
 5 min
5 min
7. shinyDashboard
Solution (example):
								library(shiny)
								library(shinydashboard)
								library(tidyverse)
								library(ggbeeswarm)

								data(iris)

								# Define UI
								ui <- dashboardPage(
									dashboardHeader(title = "My Shiny App"),
										dashboardSidebar(
											sliderInput("dotsize", "Dot Size", min=0.1, max=5, value=1, step=0.1),
											downloadButton(
												outputId  = 'save_violinplot',
												label     = 'Save plot',
												icon      = shiny::icon('download')
											)
										),
										dashboardBody(
											plotOutput("plot")
										)
								)

								# Define server logic
								server <- function(input, output) {
									violinplot <- reactive({
										ggplot(iris, aes(x=Species, y=Petal.Length)) +
											geom_violin(aes(fill=Species)) +
											geom_quasirandom(size=input$dotsize) +
											geom_boxplot(width=0.1)
									})

									output$plot <- renderPlot({
										violinplot()
									})

									output$save_violinplot <- downloadHandler(
										filename    = 'plot.pdf',
										content     = function(file) {
											ggsave(file, plot=violinplot(), width=297, height=210, unit='mm')
										})
								}

								# Run the application
								shinyApp(ui = ui, server = server)
7. shinyDashboard
- Run the app - does everything look good?
-
Check the download button - misaligned and wrong colour 😢
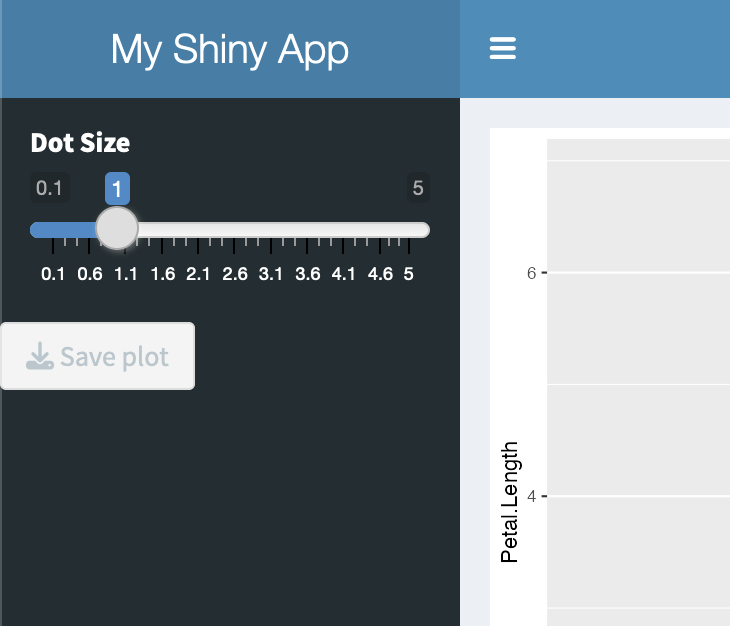
- → Go to the Webdevelopment lecture!
7. shinyDashboard
Refine the layout - rows & boxes
- Shinydashboard utilizes Bootstrap, a CSS framework
- It incorporates a 12-column grid system
- Content is organised into rows and boxes
- Boxes range in width from 1 to 12 columns
-
CSS classes with color schemes ("status") named:
success, primary, warning, and danger.
UI
									fluidRow(
										box(
											width       = 12,
											status      = 'success',
											title       = 'Plot',
											plotOutput("plot")
										)
Task: Put your plotOutput inside a fluidRow(box(...))
 10 min
8. Brushes
We can use brushes to place a selection on a plot
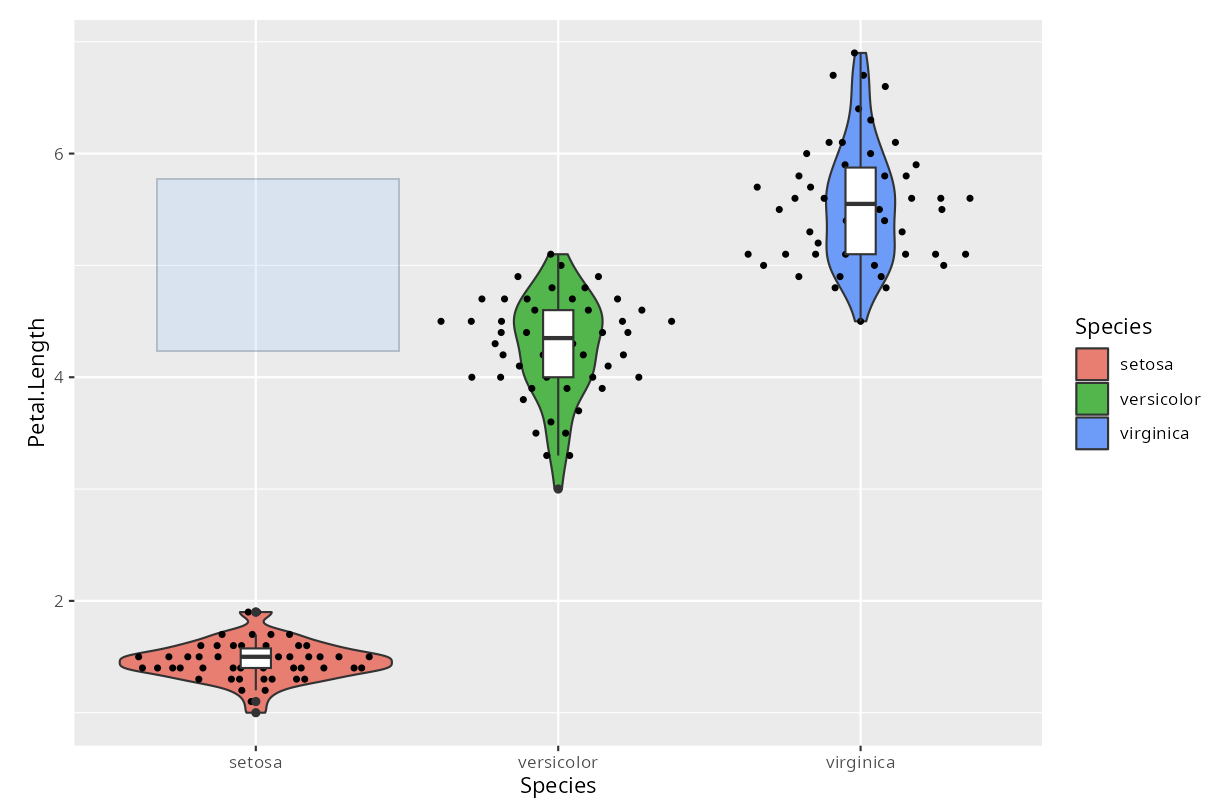
- Brushes are defined in the UI...
-
...as parameter in plotOutput
											plotOutput(
												"plot",
												brush = "plot_brush"
											)
8. Brushes
We can use brushes to place a selection on a plot
- Brushes are defined in the UI...
-
...as parameter in plotOutput
											plotOutput(
												"plot",
												brush = "plot_brush"
											)
- They have an ID
-
and are accessed with input$ID
# (inside server function) selected <- reactive({ brushedPoints(iris, input$plot_brush) }) - brushedPoints() can be used to retrieve selected dots in the plot
8. Brushes
DataTable Output
data.frames, such as the selected dots, can be output using DataTables
Server
								output$table_selected <- renderDataTable(
									selected()
								)
UI
dataTableOutput(outputId='table_selected')
8. Brushes
Requirements:
- For the moment, please change geom_quasirandom to geom_point!
8. Brushes
Task: add a brush to your plot and output selected data
Steps:
- Add a brush to plotOutput
- Retrieve selected dots with brushedPoints()
- Create an output, using renderDataTable({})
- Create a new fluidRow in the UI
- Output the DataTable there, using dataTableOutput()
- Check the IDs of the brush/output
 15 min
Code:
									# UI
									plotOutput(
										"plot",
										brush = "plot_brush"
									)
									# Server
									selected  <- reactive({
										brushedPoints(iris, input$plot_brush)
									})
									# Server
									output$table_selected <- renderDataTable(
										selected()
									)
									# UI
									fluidRow(
										box(
											width       = 12,
											status      = 'primary',
											title       = 'Data',
											dataTableOutput(outputId='table_selected')
										)
									)
8. Brushes
Task: add a brush to your plot and output selected data
Steps:
- Add a brush to plotOutput
- Retrieve selected dots with brushedPoints()
- Create an output, using renderDataTable({})
- Create a new fluidRow in the UI
- Output the DataTable there, using dataTableOutput()
- Check the IDs of the brush/output
 15 min
Code:
									# UI
									plotOutput(
										"plot",
										brush = "plot_brush"
									)
									# Server
									selected  <- reactive({
										brushedPoints(iris, input$plot_brush)
									})
									# Server
									output$table_selected <- renderDataTable(
										selected()
									)
									# UI
									fluidRow(
										box(
											width       = 12,
											status      = 'primary',
											title       = 'Data',
											dataTableOutput(outputId='table_selected')
										)
									)
8. Brushes
Solution (example)
								library(shiny)
								library(shinydashboard)
								library(tidyverse)
								library(ggbeeswarm)

								data(iris)

								# Define UI
								ui <- dashboardPage(
									dashboardHeader(
										title = "My Shiny App"
									),
									dashboardSidebar(
										sliderInput("dotsize", "Dot Size", min=0.1, max=5, value=1, step=0.1),
										downloadButton(
											outputId  = 'save_violinplot',
											label     = 'Save plot',
											icon      = shiny::icon('download')
										)
									),
									dashboardBody(
										tags$head(
											includeCSS('04_includeCSS.css')
										),
										fluidRow(
											box(
												width       = 12,
												status      = 'success',
												title       = 'Plot',
												plotOutput(
													"plot",
													brush = "plot_brush"
												)
											),
										),
										fluidRow(
											box(
												width       = 12,
												status      = 'primary',
												title       = 'Data',
												dataTableOutput(outputId='table_selected')
											)
										)
									)
								)

								# Define server logic
								server <- function(input, output) {
									violinplot <- reactive({
										ggplot(iris, aes(x=Species, y=Petal.Length)) +
											geom_violin(aes(fill=Species)) +
											geom_point(size=input$dotsize) +
											geom_boxplot(width=0.1) +
											theme(aspect.ratio=3/4)
									})

									selected  <- reactive({
										brushedPoints(iris, input$plot_brush)
									})

									output$plot <- renderPlot({
										violinplot()
									})

									output$save_violinplot <- downloadHandler(
										filename    = 'plot.pdf',
										content     = function(file) {
											ggsave(file, plot=violinplot(), width=297, height=210, unit='mm')
										})

									output$table_selected <- renderDataTable(
										selected()
									)
								}

								# Run the application
								shinyApp(ui = ui, server = server)
8. Brushes - Extended
Let's add back geom_quasirandom (replace geom_point) - does the brush still work as expected?
- geom_quasirandom scatters the points on the x-axis and changes their value in the plot
- brushedPoints() still searches for the original values (which is a good thing)
- Use the following function to retrieve the original values through the scattered values from the plot
"Outside"
								# Filters and returns rows from a dataset dset
								# where the x and y coordinates fall within the boundaries defined by a brush object,
								# based on data extracted from a specified layer
								find_dots <- function(dset, plot, layer, brush) {
									tmp <- layer_data(plot, layer)
									idx <- tmp$x >= brush$xmin & tmp$x <= brush$xmax & tmp$y >= brush$ymin & tmp$y <= brush$ymax
									return(dset[idx, ])
								}
Server
								# Replace brushedPoints()
								# Reactively identify the dots selected in the plot using the brush.
								# 2 corresponds to the layer of the geom_quasirandom function
								selected  <- reactive({
									req(input$plot_brush)
									find_dots(data_subset(), violinplot(), 2, input$plot_brush)
								})
9. Brush-based Zoom-in
- We can also use the coordinates from the brush to zoom-in into our plots with a little trick:
- We simply limit the coordinates of our plots to the values from the brush
- And we can do this when double-clicking on the plot
Server
								# Initialize zoom (NULL = no-zoom)
								zoom  <- reactiveValues(x = NULL, y = NULL)

								observeEvent(input$plot_dblclick, {
									if (!is.null(input$plot_brush)) {
										zoom$x <- c(input$plot_brush$xmin, input$plot_brush$xmax)
										zoom$y <- c(input$plot_brush$ymin, input$plot_brush$ymax)
									} else {
										zoom$x <- NULL
										zoom$y <- NULL
									}
								})

								violinplot  <- reactive({
									ggplot(data_subset(), aes(x=Species, y=Petal.Length)) +
										geom_violin(aes(fill=Species)) +
										geom_quasirandom(size=input$size) +
										geom_boxplot(width=0.1) +
										coord_cartesian(xlim=zoom$x, ylim=zoom$y, expand=T) +
										theme(aspect.ratio=3/4)
								})
UI
									plotOutput(
										outputId  = 'plot',
										dblclick  = 'plot_dblclick',
										brush     = brushOpts(
											id          = 'plot_brush',
											resetOnNew  = T
										)
									)
- Using observeEvent() on the server, we watch for the dblclick event from plotOutput()
- In addition, we change the brush definition, so we can set resetOnNew to TRUE
- The latter removes the brush whenever the plot is redrawn, making zooming-out on double-click more convenient
- If there is no brush when a double-click event happens on the plot, zoom becomes NULL and the coordinates of the plot are reset
Good job! 👍